Below you can compare the performance of our Open Banking API against the performance of our direct user interfaces for both Retail and Business products.
This data is updated once every quarter and contains the daily average values for the previous quarter. The quarterly average shown in each chart is measured as the average of all daily values within the quarter.
Uptime
Daily uptime is defined as the percentage of minutes in the day where the average technical error rate was below 5%.
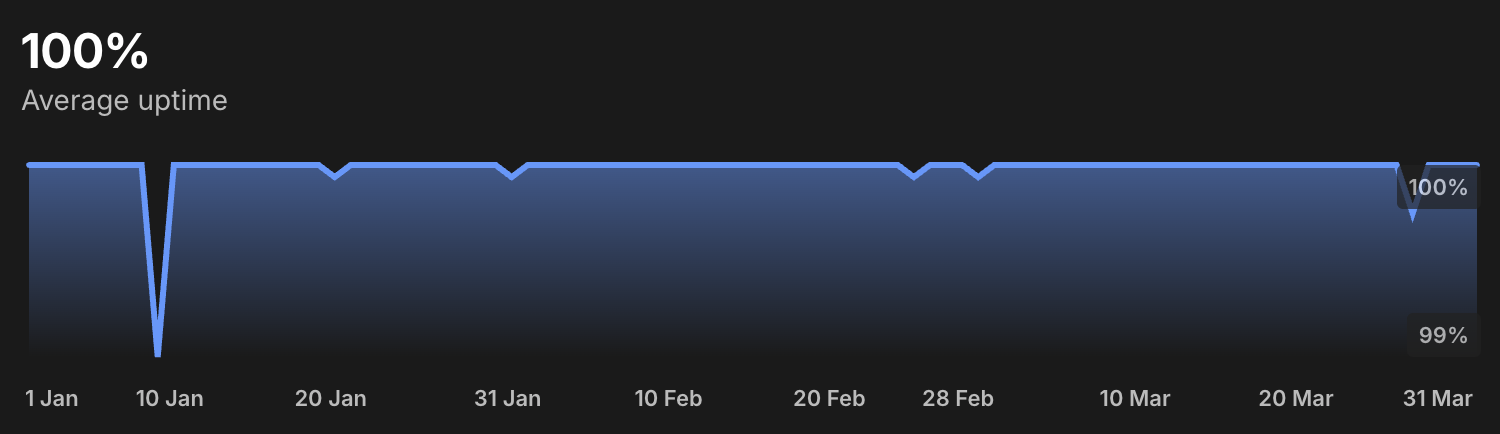
Daily values
| Date | Open Banking API | Retail | Business |
|---|---|---|---|
| 2026-01-01 | 100% | 100% | 100% |
| 2026-01-02 | 100% | 100% | 100% |
| 2026-01-03 | 100% | 100% | 100% |
| 2026-01-04 | 100% | 100% | 100% |
| 2026-01-05 | 100% | 100% | 99.93% |
| 2026-01-06 | 100% | 100% | 100% |
| 2026-01-07 | 100% | 100% | 100% |
| 2026-01-08 | 100% | 100% | 100% |
| 2026-01-09 | 98.89% | 98.89% | 98.89% |
| 2026-01-10 | 100% | 100% | 100% |
| 2026-01-11 | 100% | 100% | 100% |
| 2026-01-12 | 100% | 100% | 100% |
| 2026-01-13 | 100% | 100% | 99.93% |
| 2026-01-14 | 100% | 100% | 100% |
| 2026-01-15 | 100% | 100% | 100% |
| 2026-01-16 | 100% | 100% | 100% |
| 2026-01-17 | 100% | 100% | 100% |
| 2026-01-18 | 100% | 100% | 99.93% |
| 2026-01-19 | 100% | 100% | 100% |
| 2026-01-20 | 99.93% | 100% | 100% |
| 2026-01-21 | 100% | 100% | 100% |
| 2026-01-22 | 100% | 100% | 100% |
| 2026-01-23 | 100% | 100% | 100% |
| 2026-01-24 | 100% | 100% | 100% |
| 2026-01-25 | 100% | 100% | 100% |
| 2026-01-26 | 100% | 100% | 100% |
| 2026-01-27 | 100% | 100% | 100% |
| 2026-01-28 | 100% | 100% | 100% |
| 2026-01-29 | 100% | 100% | 100% |
| 2026-01-30 | 100% | 100% | 99.93% |
| 2026-01-31 | 99.93% | 100% | 99.93% |
| 2026-02-01 | 100% | 100% | 100% |
| 2026-02-02 | 100% | 100% | 100% |
| 2026-02-03 | 100% | 100% | 99.93% |
| 2026-02-04 | 100% | 100% | 100% |
| 2026-02-05 | 100% | 100% | 100% |
| 2026-02-06 | 100% | 100% | 100% |
| 2026-02-07 | 100% | 100% | 100% |
| 2026-02-08 | 100% | 100% | 100% |
| 2026-02-09 | 100% | 100% | 100% |
| 2026-02-10 | 100% | 100% | 100% |
| 2026-02-11 | 100% | 100% | 100% |
| 2026-02-12 | 100% | 100% | 100% |
| 2026-02-13 | 100% | 100% | 100% |
| 2026-02-14 | 100% | 100% | 100% |
| 2026-02-15 | 100% | 100% | 100% |
| 2026-02-16 | 100% | 100% | 100% |
| 2026-02-17 | 100% | 100% | 100% |
| 2026-02-18 | 100% | 100% | 100% |
| 2026-02-19 | 100% | 100% | 100% |
| 2026-02-20 | 100% | 100% | 99.79% |
| 2026-02-21 | 100% | 100% | 100% |
| 2026-02-22 | 100% | 100% | 100% |
| 2026-02-23 | 100% | 100% | 100% |
| 2026-02-24 | 100% | 100% | 100% |
| 2026-02-25 | 99.93% | 100% | 100% |
| 2026-02-26 | 100% | 100% | 100% |
| 2026-02-27 | 100% | 100% | 100% |
| 2026-02-28 | 100% | 100% | 100% |
| 2026-03-01 | 99.93% | 100% | 100% |
| 2026-03-02 | 100% | 100% | 100% |
| 2026-03-03 | 100% | 100% | 100% |
| 2026-03-04 | 100% | 100% | 100% |
| 2026-03-05 | 100% | 100% | 100% |
| 2026-03-06 | 100% | 100% | 100% |
| 2026-03-07 | 100% | 100% | 100% |
| 2026-03-08 | 100% | 100% | 100% |
| 2026-03-09 | 100% | 100% | 100% |
| 2026-03-10 | 100% | 100% | 100% |
| 2026-03-11 | 100% | 100% | 100% |
| 2026-03-12 | 100% | 100% | 100% |
| 2026-03-13 | 100% | 100% | 100% |
| 2026-03-14 | 100% | 100% | 100% |
| 2026-03-15 | 100% | 100% | 100% |
| 2026-03-16 | 100% | 100% | 100% |
| 2026-03-17 | 100% | 100% | 100% |
| 2026-03-18 | 100% | 100% | 100% |
| 2026-03-19 | 100% | 100% | 100% |
| 2026-03-20 | 100% | 100% | 100% |
| 2026-03-21 | 100% | 100% | 100% |
| 2026-03-22 | 100% | 100% | 100% |
| 2026-03-23 | 100% | 100% | 100% |
| 2026-03-24 | 100% | 100% | 100% |
| 2026-03-25 | 100% | 100% | 100% |
| 2026-03-26 | 100% | 100% | 100% |
| 2026-03-27 | 99.72% | 99.72% | 99.72% |
| 2026-03-28 | 100% | 100% | 100% |
| 2026-03-29 | 100% | 100% | 100% |
| 2026-03-30 | 100% | 100% | 100% |
| 2026-03-31 | 100% | 100% | 100% |
Error rate
Error rate is calculated as the percentage of requests which return a technical error (HTTP 5XX).
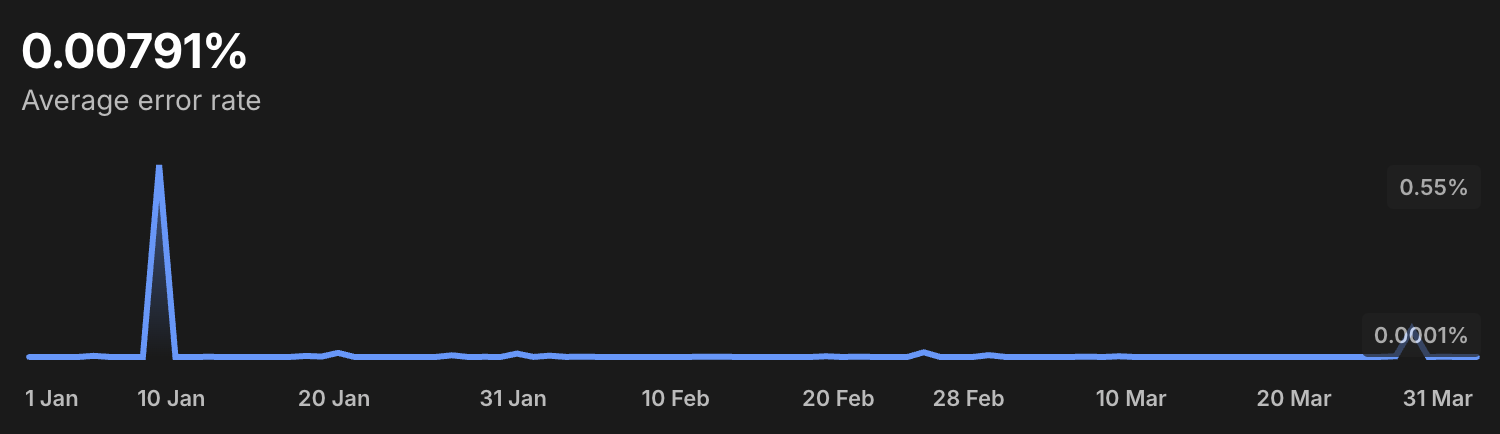
Daily values
| Date | Open Banking API | Retail | Business |
|---|---|---|---|
| 2026-01-01 | 0.0002% | 0.0003% | 0.0023% |
| 2026-01-02 | 0.0002% | 0.0002% | 0.0021% |
| 2026-01-03 | 0.0002% | 0.0003% | 0.0039% |
| 2026-01-04 | 0.0001% | 0.0002% | 0.0025% |
| 2026-01-05 | 0.0034% | 0.0003% | 0.0102% |
| 2026-01-06 | 0.0001% | 0.0003% | 0.0029% |
| 2026-01-07 | 0.0002% | 0.0002% | 0.0056% |
| 2026-01-08 | 0.0002% | 0.0002% | 0.0061% |
| 2026-01-09 | 0.5476% | 0.5091% | 0.2691% |
| 2026-01-10 | 0.0001% | 0.0001% | 0.0048% |
| 2026-01-11 | 0.0001% | 0.0001% | 0.003% |
| 2026-01-12 | 0.0006% | 0.0007% | 0.0037% |
| 2026-01-13 | 0.0002% | 0.0003% | 0.0078% |
| 2026-01-14 | 0.0001% | 0.0001% | 0.0039% |
| 2026-01-15 | 0.0002% | 0.0015% | 0.0043% |
| 2026-01-16 | 0.0002% | 0.0002% | 0.0035% |
| 2026-01-17 | 0.0001% | 0.0002% | 0.0035% |
| 2026-01-18 | 0.0031% | 0.0006% | 0.0092% |
| 2026-01-19 | 0.0014% | 0.0002% | 0.0039% |
| 2026-01-20 | 0.0119% | 0.0002% | 0.0046% |
| 2026-01-21 | 0.0002% | 0.0002% | 0.0063% |
| 2026-01-22 | 0.0001% | 0.0001% | 0.0289% |
| 2026-01-23 | 0.0002% | 0.0002% | 0.0034% |
| 2026-01-24 | 0.0002% | 0.0001% | 0.0035% |
| 2026-01-25 | 0.0002% | 0.0001% | 0.004% |
| 2026-01-26 | 0.0002% | 0.0001% | 0.0025% |
| 2026-01-27 | 0.0049% | 0.0011% | 0.0183% |
| 2026-01-28 | 0.0002% | 0.0001% | 0.0034% |
| 2026-01-29 | 0.0005% | 0.0003% | 0.0024% |
| 2026-01-30 | 0.0003% | 0.0002% | 0.0168% |
| 2026-01-31 | 0.0098% | 0.0019% | 0.0138% |
| 2026-02-01 | 0.0003% | 0.0002% | 0.0029% |
| 2026-02-02 | 0.0038% | 0.0008% | 0.004% |
| 2026-02-03 | 0.0004% | 0.0002% | 0.0089% |
| 2026-02-04 | 0.0007% | 0.0001% | 0.0032% |
| 2026-02-05 | 0.0004% | 0.0001% | 0.0024% |
| 2026-02-06 | 0.0003% | 0.0001% | 0.0041% |
| 2026-02-07 | 0.0004% | 0.0002% | 0.0034% |
| 2026-02-08 | 0.0004% | 0.0001% | 0.0038% |
| 2026-02-09 | 0.0003% | 0.0002% | 0.0038% |
| 2026-02-10 | 0.0003% | 0.0004% | 0.0035% |
| 2026-02-11 | 0.0005% | 0.0006% | 0.0031% |
| 2026-02-12 | 0.0008% | 0.0003% | 0.003% |
| 2026-02-13 | 0.0005% | 0.0002% | 0.0028% |
| 2026-02-14 | 0.0003% | 0.0001% | 0.0035% |
| 2026-02-15 | 0.0001% | 0.0006% | 0.003% |
| 2026-02-16 | 0.0003% | 0.0005% | 0.002% |
| 2026-02-17 | 0.0001% | 0.0004% | 0.0046% |
| 2026-02-18 | 0.0001% | 0.0007% | 0.0023% |
| 2026-02-19 | 0.0021% | 0.0046% | 0.0025% |
| 2026-02-20 | 0.0001% | 0.0004% | 0.0295% |
| 2026-02-21 | 0.0011% | 0.0016% | 0.002% |
| 2026-02-22 | 0.0002% | 0.0002% | 0.0026% |
| 2026-02-23 | 0.0002% | 0.0005% | 0.0034% |
| 2026-02-24 | 0.0003% | 0.0005% | 0.0021% |
| 2026-02-25 | 0.0136% | 0.0008% | 0.0032% |
| 2026-02-26 | 0.0001% | 0.0021% | 0.0022% |
| 2026-02-27 | 0.0001% | 0.0015% | 0.0038% |
| 2026-02-28 | 0.0001% | 0.0007% | 0.0016% |
| 2026-03-01 | 0.0054% | 0.0009% | 0.0013% |
| 2026-03-02 | 0.0003% | 0.0004% | 0.0018% |
| 2026-03-03 | 0.0002% | 0.0005% | 0.0017% |
| 2026-03-04 | 0.0001% | 0.0005% | 0.0022% |
| 2026-03-05 | 0.0002% | 0.0003% | 0.002% |
| 2026-03-06 | 0.0002% | 0.0003% | 0.0018% |
| 2026-03-07 | 0.0011% | 0.0002% | 0.0014% |
| 2026-03-08 | 0.0001% | 0.0003% | 0.0023% |
| 2026-03-09 | 0.0021% | 0.0023% | 0.0018% |
| 2026-03-10 | 0.0001% | 0.0003% | 0.0023% |
| 2026-03-11 | 0.0001% | 0.0003% | 0.0023% |
| 2026-03-12 | 0.0002% | 0.0008% | 0.0035% |
| 2026-03-13 | 0.0003% | 0.0003% | 0.0016% |
| 2026-03-14 | 0.0002% | 0.0002% | 0.002% |
| 2026-03-15 | 0.0001% | 0.0003% | 0.0029% |
| 2026-03-16 | 0.0001% | 0.0002% | 0.0015% |
| 2026-03-17 | 0.0003% | 0.0005% | 0.0024% |
| 2026-03-18 | 0.0002% | 0.0005% | 0.0042% |
| 2026-03-19 | 0.0002% | 0.0005% | 0.0026% |
| 2026-03-20 | 0.0004% | 0.0014% | 0.0065% |
| 2026-03-21 | 0.0003% | 0.002% | 0.0153% |
| 2026-03-22 | 0.0003% | 0.0002% | 0.0041% |
| 2026-03-23 | 0.0004% | 0.0007% | 0.003% |
| 2026-03-24 | 0.0002% | 0.0004% | 0.0034% |
| 2026-03-25 | 0.0002% | 0.0003% | 0.0032% |
| 2026-03-26 | 0.0021% | 0.0009% | 0.003% |
| 2026-03-27 | 0.0801% | 0.067% | 0.16% |
| 2026-03-28 | 0.0002% | 0.0002% | 0.0024% |
| 2026-03-29 | 0.0007% | 0.0003% | 0.0025% |
| 2026-03-30 | 0.0002% | 0.0007% | 0.0031% |
| 2026-03-31 | 0.0003% | 0.0005% | 0.0025% |
Account Information response time
Account Information average response time is calculated as the average response time of requests for account or transaction data.
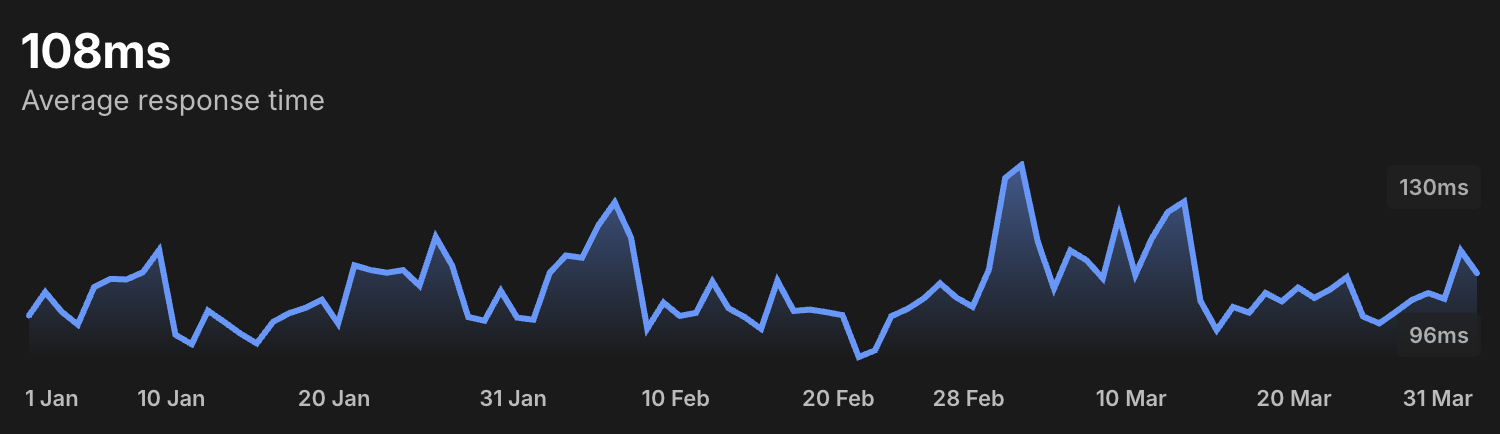
Daily values
| Date | Open Banking API | Retail | Business |
|---|---|---|---|
| 2026-01-01 | 103.43 ms | 67.93 ms | 101.41 ms |
| 2026-01-02 | 107.42 ms | 66.202 ms | 106.41 ms |
| 2026-01-03 | 104.1 ms | 62.943 ms | 103.3 ms |
| 2026-01-04 | 101.88 ms | 59.734 ms | 99.873 ms |
| 2026-01-05 | 108.27 ms | 64.548 ms | 107.82 ms |
| 2026-01-06 | 109.67 ms | 62.509 ms | 108.95 ms |
| 2026-01-07 | 109.58 ms | 59.348 ms | 107.52 ms |
| 2026-01-08 | 110.8 ms | 59.487 ms | 102.32 ms |
| 2026-01-09 | 114.59 ms | 70.351 ms | 100.56 ms |
| 2026-01-10 | 100.15 ms | 56.407 ms | 88.174 ms |
| 2026-01-11 | 98.548 ms | 55.258 ms | 91.963 ms |
| 2026-01-12 | 104.26 ms | 57.488 ms | 96.335 ms |
| 2026-01-13 | 102.34 ms | 54.069 ms | 95.478 ms |
| 2026-01-14 | 100.34 ms | 51.15 ms | 95.181 ms |
| 2026-01-15 | 98.676 ms | 51.878 ms | 95.977 ms |
| 2026-01-16 | 102.35 ms | 53.143 ms | 99.277 ms |
| 2026-01-17 | 103.84 ms | 52.144 ms | 95.174 ms |
| 2026-01-18 | 104.74 ms | 50.969 ms | 96.144 ms |
| 2026-01-19 | 106.13 ms | 52.974 ms | 97.476 ms |
| 2026-01-20 | 102.06 ms | 54.098 ms | 98.739 ms |
| 2026-01-21 | 111.99 ms | 58.151 ms | 102.71 ms |
| 2026-01-22 | 111.18 ms | 59.295 ms | 127.85 ms |
| 2026-01-23 | 110.72 ms | 60.484 ms | 100.7 ms |
| 2026-01-24 | 111.17 ms | 61.464 ms | 96.581 ms |
| 2026-01-25 | 108.52 ms | 60.539 ms | 96.398 ms |
| 2026-01-26 | 116.83 ms | 67.572 ms | 98.45 ms |
| 2026-01-27 | 112 ms | 76.412 ms | 101.58 ms |
| 2026-01-28 | 103.17 ms | 81.082 ms | 98.571 ms |
| 2026-01-29 | 102.55 ms | 73.464 ms | 102.42 ms |
| 2026-01-30 | 107.63 ms | 68.637 ms | 103.22 ms |
| 2026-01-31 | 103.08 ms | 61.879 ms | 98.204 ms |
| 2026-02-01 | 102.71 ms | 59.202 ms | 97.807 ms |
| 2026-02-02 | 110.69 ms | 61.637 ms | 97.312 ms |
| 2026-02-03 | 113.66 ms | 61.452 ms | 102.29 ms |
| 2026-02-04 | 113.28 ms | 77.24 ms | 98.297 ms |
| 2026-02-05 | 118.82 ms | 91.494 ms | 92.805 ms |
| 2026-02-06 | 122.71 ms | 78.926 ms | 91.425 ms |
| 2026-02-07 | 116.74 ms | 70.492 ms | 85.059 ms |
| 2026-02-08 | 101.19 ms | 67.79 ms | 83.719 ms |
| 2026-02-09 | 105.64 ms | 83.676 ms | 89.902 ms |
| 2026-02-10 | 103.36 ms | 93.36 ms | 86.587 ms |
| 2026-02-11 | 103.89 ms | 82.994 ms | 86.32 ms |
| 2026-02-12 | 109.24 ms | 86.56 ms | 89.255 ms |
| 2026-02-13 | 104.66 ms | 78.552 ms | 96.628 ms |
| 2026-02-14 | 103.14 ms | 67.839 ms | 91.635 ms |
| 2026-02-15 | 101.15 ms | 63.636 ms | 89.274 ms |
| 2026-02-16 | 109.37 ms | 79.169 ms | 97.359 ms |
| 2026-02-17 | 104.21 ms | 78.154 ms | 110.4 ms |
| 2026-02-18 | 104.44 ms | 69.773 ms | 95.955 ms |
| 2026-02-19 | 104.01 ms | 65.369 ms | 95.542 ms |
| 2026-02-20 | 103.5 ms | 64.918 ms | 96.459 ms |
| 2026-02-21 | 96.364 ms | 62.748 ms | 88.606 ms |
| 2026-02-22 | 97.495 ms | 61.545 ms | 94.084 ms |
| 2026-02-23 | 103.31 ms | 64.078 ms | 95.005 ms |
| 2026-02-24 | 104.57 ms | 63.143 ms | 99.797 ms |
| 2026-02-25 | 106.34 ms | 61.139 ms | 102.81 ms |
| 2026-02-26 | 108.91 ms | 66.276 ms | 99.345 ms |
| 2026-02-27 | 106.5 ms | 61.088 ms | 102.49 ms |
| 2026-02-28 | 104.91 ms | 61.816 ms | 102.08 ms |
| 2026-03-01 | 111.26 ms | 63.158 ms | 101.34 ms |
| 2026-03-02 | 126.87 ms | 64.109 ms | 106.3 ms |
| 2026-03-03 | 129.08 ms | 69.248 ms | 103.33 ms |
| 2026-03-04 | 116.06 ms | 67.647 ms | 99.57 ms |
| 2026-03-05 | 108.04 ms | 62.302 ms | 103.56 ms |
| 2026-03-06 | 114.53 ms | 76.91 ms | 107.11 ms |
| 2026-03-07 | 112.85 ms | 65.814 ms | 100.69 ms |
| 2026-03-08 | 109.77 ms | 62.237 ms | 102.48 ms |
| 2026-03-09 | 120.44 ms | 67.071 ms | 104.67 ms |
| 2026-03-10 | 110.36 ms | 66.254 ms | 103.97 ms |
| 2026-03-11 | 116.51 ms | 65.746 ms | 99.349 ms |
| 2026-03-12 | 121.07 ms | 77.635 ms | 99.843 ms |
| 2026-03-13 | 122.84 ms | 82.356 ms | 109.82 ms |
| 2026-03-14 | 105.94 ms | 68.09 ms | 102.77 ms |
| 2026-03-15 | 100.93 ms | 62.858 ms | 99.951 ms |
| 2026-03-16 | 104.89 ms | 63.058 ms | 108.52 ms |
| 2026-03-17 | 103.92 ms | 63.611 ms | 102.89 ms |
| 2026-03-18 | 107.27 ms | 60.324 ms | 101.39 ms |
| 2026-03-19 | 105.83 ms | 58.412 ms | 102.56 ms |
| 2026-03-20 | 108.21 ms | 56.949 ms | 99.015 ms |
| 2026-03-21 | 106.43 ms | 54.541 ms | 93.367 ms |
| 2026-03-22 | 107.92 ms | 52.506 ms | 97.542 ms |
| 2026-03-23 | 109.97 ms | 57.806 ms | 110.02 ms |
| 2026-03-24 | 103.26 ms | 55.962 ms | 108.16 ms |
| 2026-03-25 | 102.09 ms | 56.48 ms | 125.85 ms |
| 2026-03-26 | 104.05 ms | 56.59 ms | 139.75 ms |
| 2026-03-27 | 106.08 ms | 59.142 ms | 138.54 ms |
| 2026-03-28 | 107.26 ms | 56.994 ms | 125.87 ms |
| 2026-03-29 | 106.28 ms | 56.575 ms | 124.01 ms |
| 2026-03-30 | 114.5 ms | 59.03 ms | 139.16 ms |
| 2026-03-31 | 110.63 ms | 62.256 ms | 144.39 ms |
Payment Initiation response time
Payment Initiation average response time is calculated as the average response time of requests for payment execution.
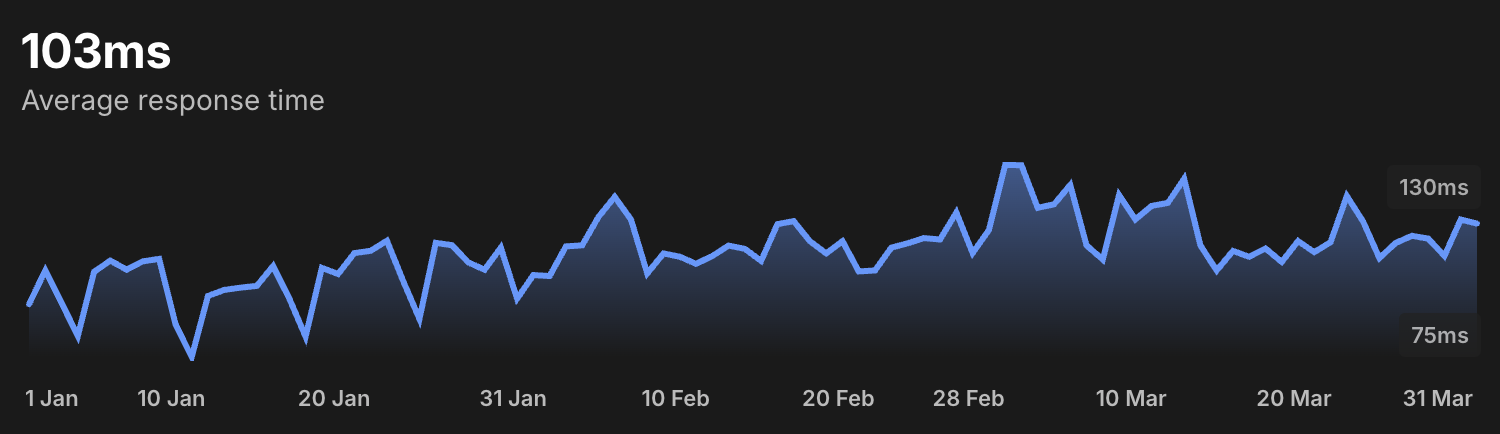
Daily values
| Date | Open Banking API | Retail | Business |
|---|---|---|---|
| 2026-01-01 | 88.675 ms | 64.896 ms | 453.05 ms |
| 2026-01-02 | 97.758 ms | 66.576 ms | 445.95 ms |
| 2026-01-03 | 89.098 ms | 65.297 ms | 443.83 ms |
| 2026-01-04 | 80.167 ms | 64.225 ms | 449.93 ms |
| 2026-01-05 | 97.4 ms | 65.861 ms | 455.42 ms |
| 2026-01-06 | 100.4 ms | 68.226 ms | 449.25 ms |
| 2026-01-07 | 97.975 ms | 64.246 ms | 417.84 ms |
| 2026-01-08 | 100.21 ms | 65.728 ms | 423.74 ms |
| 2026-01-09 | 100.86 ms | 69.467 ms | 454.89 ms |
| 2026-01-10 | 83.422 ms | 63.978 ms | 433.33 ms |
| 2026-01-11 | 74.548 ms | 63.985 ms | 431.63 ms |
| 2026-01-12 | 90.92 ms | 65.022 ms | 432.65 ms |
| 2026-01-13 | 92.538 ms | 64.692 ms | 414.3 ms |
| 2026-01-14 | 93.148 ms | 63.305 ms | 413.52 ms |
| 2026-01-15 | 93.62 ms | 63.277 ms | 430.72 ms |
| 2026-01-16 | 98.924 ms | 64.98 ms | 434.93 ms |
| 2026-01-17 | 90.241 ms | 63.559 ms | 413.03 ms |
| 2026-01-18 | 79.998 ms | 63.316 ms | 414.08 ms |
| 2026-01-19 | 98.463 ms | 62.819 ms | 414.88 ms |
| 2026-01-20 | 96.808 ms | 63.2 ms | 420.67 ms |
| 2026-01-21 | 102.42 ms | 65.293 ms | 430.92 ms |
| 2026-01-22 | 103.03 ms | 66.342 ms | 455.19 ms |
| 2026-01-23 | 105.74 ms | 66.624 ms | 445.4 ms |
| 2026-01-24 | 94.905 ms | 61.781 ms | 425.15 ms |
| 2026-01-25 | 84.758 ms | 60.879 ms | 416.65 ms |
| 2026-01-26 | 105.17 ms | 63.093 ms | 424.64 ms |
| 2026-01-27 | 104.53 ms | 64.62 ms | 425.04 ms |
| 2026-01-28 | 99.931 ms | 66.198 ms | 425.61 ms |
| 2026-01-29 | 97.958 ms | 66.309 ms | 428.22 ms |
| 2026-01-30 | 103.88 ms | 69.118 ms | 451.83 ms |
| 2026-01-31 | 90.198 ms | 65.487 ms | 432.25 ms |
| 2026-02-01 | 96.525 ms | 64.01 ms | 427.77 ms |
| 2026-02-02 | 96.267 ms | 66.387 ms | 425.57 ms |
| 2026-02-03 | 104.22 ms | 65.434 ms | 428.72 ms |
| 2026-02-04 | 104.5 ms | 65.511 ms | 419.88 ms |
| 2026-02-05 | 112.11 ms | 68.789 ms | 439.69 ms |
| 2026-02-06 | 117.51 ms | 68.781 ms | 429.88 ms |
| 2026-02-07 | 111.43 ms | 64.802 ms | 418.64 ms |
| 2026-02-08 | 96.965 ms | 62.403 ms | 412.33 ms |
| 2026-02-09 | 102.33 ms | 64.863 ms | 415.58 ms |
| 2026-02-10 | 101.45 ms | 64.545 ms | 424.58 ms |
| 2026-02-11 | 99.544 ms | 63.537 ms | 410.73 ms |
| 2026-02-12 | 101.63 ms | 63.106 ms | 405.65 ms |
| 2026-02-13 | 104.43 ms | 67.089 ms | 441.55 ms |
| 2026-02-14 | 103.56 ms | 62.919 ms | 427.5 ms |
| 2026-02-15 | 100.33 ms | 61.624 ms | 421.32 ms |
| 2026-02-16 | 110.18 ms | 65.659 ms | 425.3 ms |
| 2026-02-17 | 111 ms | 63.703 ms | 406.74 ms |
| 2026-02-18 | 105.6 ms | 61.106 ms | 398.05 ms |
| 2026-02-19 | 102.34 ms | 62.283 ms | 428.28 ms |
| 2026-02-20 | 105.62 ms | 63.025 ms | 458.94 ms |
| 2026-02-21 | 97.505 ms | 61.992 ms | 423.68 ms |
| 2026-02-22 | 97.765 ms | 61.847 ms | 424.11 ms |
| 2026-02-23 | 103.88 ms | 65.878 ms | 413.07 ms |
| 2026-02-24 | 105.04 ms | 64.799 ms | 408.16 ms |
| 2026-02-25 | 106.44 ms | 66.144 ms | 407.1 ms |
| 2026-02-26 | 106.07 ms | 70.057 ms | 425.31 ms |
| 2026-02-27 | 113.34 ms | 68.74 ms | 432.56 ms |
| 2026-02-28 | 102.45 ms | 66.715 ms | 438.4 ms |
| 2026-03-01 | 108.6 ms | 65.84 ms | 446.87 ms |
| 2026-03-02 | 126.05 ms | 72.031 ms | 466.43 ms |
| 2026-03-03 | 126 ms | 69.734 ms | 441.57 ms |
| 2026-03-04 | 114.56 ms | 68.509 ms | 433.19 ms |
| 2026-03-05 | 115.5 ms | 70.961 ms | 441.68 ms |
| 2026-03-06 | 120.7 ms | 70.832 ms | 447.39 ms |
| 2026-03-07 | 104.48 ms | 67.462 ms | 459.54 ms |
| 2026-03-08 | 100.69 ms | 67.499 ms | 472.96 ms |
| 2026-03-09 | 118.01 ms | 68.988 ms | 441.69 ms |
| 2026-03-10 | 111.45 ms | 72.149 ms | 431.77 ms |
| 2026-03-11 | 115.07 ms | 76.165 ms | 427.67 ms |
| 2026-03-12 | 115.89 ms | 74.595 ms | 421.75 ms |
| 2026-03-13 | 122.35 ms | 77.766 ms | 447.94 ms |
| 2026-03-14 | 104.48 ms | 73.67 ms | 420.57 ms |
| 2026-03-15 | 97.757 ms | 70.875 ms | 416.45 ms |
| 2026-03-16 | 103 ms | 75.268 ms | 416.54 ms |
| 2026-03-17 | 101.43 ms | 74.644 ms | 413.01 ms |
| 2026-03-18 | 103.67 ms | 76.97 ms | 441.78 ms |
| 2026-03-19 | 100.05 ms | 72.963 ms | 415.55 ms |
| 2026-03-20 | 105.64 ms | 72.864 ms | 392.23 ms |
| 2026-03-21 | 102.68 ms | 70.79 ms | 406.35 ms |
| 2026-03-22 | 105.34 ms | 71.069 ms | 433.81 ms |
| 2026-03-23 | 117.74 ms | 79.841 ms | 421.63 ms |
| 2026-03-24 | 110.89 ms | 74.093 ms | 400.45 ms |
| 2026-03-25 | 101.09 ms | 73.308 ms | 391.21 ms |
| 2026-03-26 | 105.13 ms | 71.276 ms | 374.89 ms |
| 2026-03-27 | 107.06 ms | 74.536 ms | 423.3 ms |
| 2026-03-28 | 106.3 ms | 70.358 ms | 423.44 ms |
| 2026-03-29 | 101.67 ms | 69.914 ms | 419.67 ms |
| 2026-03-30 | 111.42 ms | 75.351 ms | 411.04 ms |
| 2026-03-31 | 110.33 ms | 75.993 ms | 421.86 ms |
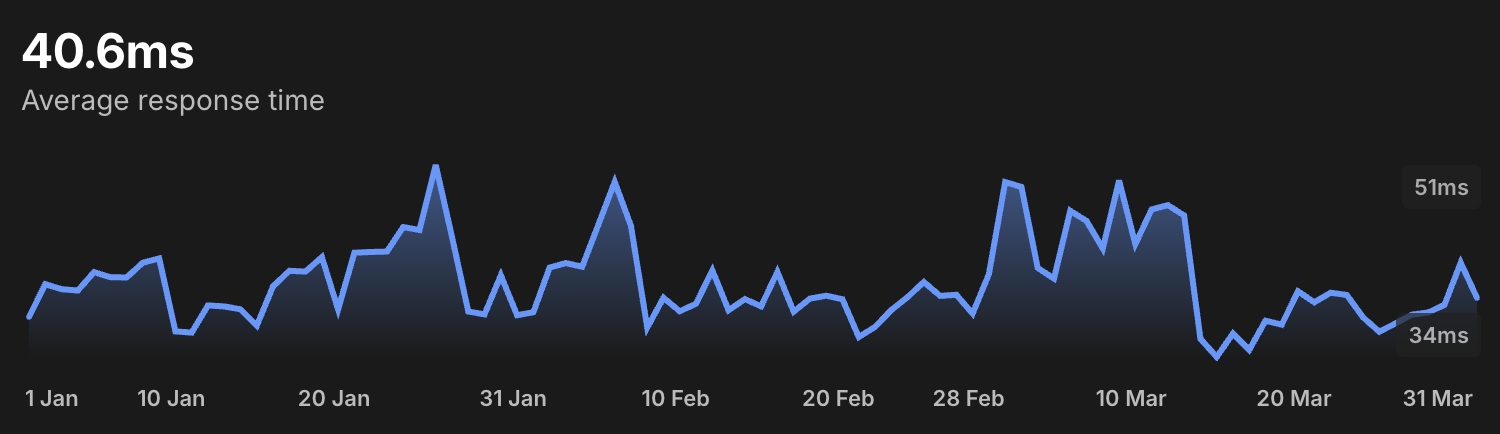
Confirmation of Funds response time
Confirmation of Funds average response time is calculated as the average response time of yes/no responses to confirmation of funds API requests. This data is only available for Open Banking API.
Daily values
| Date | Open Banking API |
|---|---|
| 2026-01-01 | 37.497 ms |
| 2026-01-02 | 40.389 ms |
| 2026-01-03 | 39.948 ms |
| 2026-01-04 | 39.827 ms |
| 2026-01-05 | 41.452 ms |
| 2026-01-06 | 41.002 ms |
| 2026-01-07 | 40.983 ms |
| 2026-01-08 | 42.286 ms |
| 2026-01-09 | 42.662 ms |
| 2026-01-10 | 36.222 ms |
| 2026-01-11 | 36.116 ms |
| 2026-01-12 | 38.514 ms |
| 2026-01-13 | 38.425 ms |
| 2026-01-14 | 38.173 ms |
| 2026-01-15 | 36.73 ms |
| 2026-01-16 | 40.196 ms |
| 2026-01-17 | 41.568 ms |
| 2026-01-18 | 41.502 ms |
| 2026-01-19 | 42.781 ms |
| 2026-01-20 | 38.162 ms |
| 2026-01-21 | 43.162 ms |
| 2026-01-22 | 43.231 ms |
| 2026-01-23 | 43.269 ms |
| 2026-01-24 | 45.431 ms |
| 2026-01-25 | 45.171 ms |
| 2026-01-26 | 50.906 ms |
| 2026-01-27 | 44.552 ms |
| 2026-01-28 | 37.982 ms |
| 2026-01-29 | 37.722 ms |
| 2026-01-30 | 41.172 ms |
| 2026-01-31 | 37.65 ms |
| 2026-02-01 | 37.911 ms |
| 2026-02-02 | 41.855 ms |
| 2026-02-03 | 42.253 ms |
| 2026-02-04 | 41.927 ms |
| 2026-02-05 | 45.657 ms |
| 2026-02-06 | 49.415 ms |
| 2026-02-07 | 45.53 ms |
| 2026-02-08 | 36.566 ms |
| 2026-02-09 | 39.187 ms |
| 2026-02-10 | 38 ms |
| 2026-02-11 | 38.663 ms |
| 2026-02-12 | 41.611 ms |
| 2026-02-13 | 38.085 ms |
| 2026-02-14 | 39.072 ms |
| 2026-02-15 | 38.438 ms |
| 2026-02-16 | 41.47 ms |
| 2026-02-17 | 37.964 ms |
| 2026-02-18 | 39.115 ms |
| 2026-02-19 | 39.375 ms |
| 2026-02-20 | 39.059 ms |
| 2026-02-21 | 35.725 ms |
| 2026-02-22 | 36.615 ms |
| 2026-02-23 | 38.104 ms |
| 2026-02-24 | 39.247 ms |
| 2026-02-25 | 40.581 ms |
| 2026-02-26 | 39.355 ms |
| 2026-02-27 | 39.452 ms |
| 2026-02-28 | 37.792 ms |
| 2026-03-01 | 41.283 ms |
| 2026-03-02 | 49.399 ms |
| 2026-03-03 | 48.97 ms |
| 2026-03-04 | 41.818 ms |
| 2026-03-05 | 40.885 ms |
| 2026-03-06 | 46.866 ms |
| 2026-03-07 | 45.966 ms |
| 2026-03-08 | 43.539 ms |
| 2026-03-09 | 49.537 ms |
| 2026-03-10 | 43.924 ms |
| 2026-03-11 | 46.984 ms |
| 2026-03-12 | 47.364 ms |
| 2026-03-13 | 46.451 ms |
| 2026-03-14 | 35.573 ms |
| 2026-03-15 | 33.962 ms |
| 2026-03-16 | 36.033 ms |
| 2026-03-17 | 34.589 ms |
| 2026-03-18 | 37.164 ms |
| 2026-03-19 | 36.817 ms |
| 2026-03-20 | 39.761 ms |
| 2026-03-21 | 38.785 ms |
| 2026-03-22 | 39.635 ms |
| 2026-03-23 | 39.434 ms |
| 2026-03-24 | 37.455 ms |
| 2026-03-25 | 36.189 ms |
| 2026-03-26 | 36.937 ms |
| 2026-03-27 | 37.701 ms |
| 2026-03-28 | 37.891 ms |
| 2026-03-29 | 38.563 ms |
| 2026-03-30 | 42.285 ms |
| 2026-03-31 | 39.178 ms |
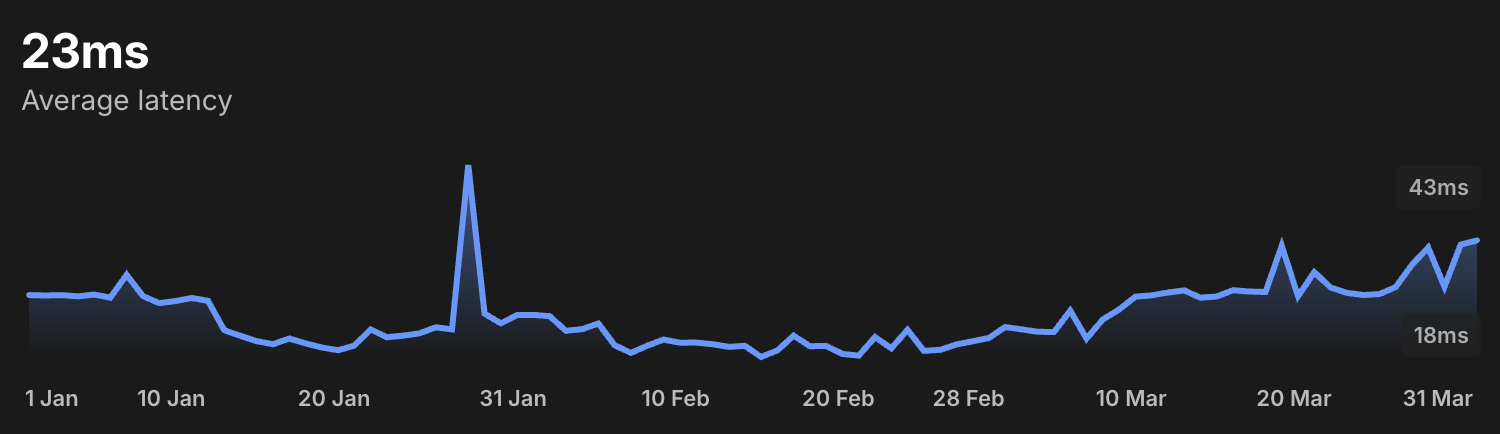
Network Latency
Network latency is calculated as the average latency for DNS resolution, connection and SSL times combined as measured from several geographical locations.
Daily values
| Date | UK | Ireland | Germany | France |
|---|---|---|---|---|
| 2026-01-01 | 25.719 ms | 24.229 ms | 22.219 ms | 19.406 ms |
| 2026-01-02 | 25.664 ms | 23.937 ms | 22.098 ms | 19.791 ms |
| 2026-01-03 | 25.714 ms | 28.677 ms | 22.22 ms | 19.941 ms |
| 2026-01-04 | 25.551 ms | 24.936 ms | 21.879 ms | 20.176 ms |
| 2026-01-05 | 25.783 ms | 24.684 ms | 21.83 ms | 20.207 ms |
| 2026-01-06 | 25.38 ms | 24.565 ms | 21.563 ms | 19.946 ms |
| 2026-01-07 | 28.394 ms | 24.658 ms | 22.134 ms | 20.62 ms |
| 2026-01-08 | 25.596 ms | 29.314 ms | 49.061 ms | 20.628 ms |
| 2026-01-09 | 24.657 ms | 45.102 ms | 22.251 ms | 22.734 ms |
| 2026-01-10 | 24.925 ms | 42.269 ms | 22.413 ms | 24.275 ms |
| 2026-01-11 | 25.337 ms | 41.078 ms | 22.756 ms | 23.937 ms |
| 2026-01-12 | 24.962 ms | 41.544 ms | 24.203 ms | 24.189 ms |
| 2026-01-13 | 21.087 ms | 39.712 ms | 39.786 ms | 41.396 ms |
| 2026-01-14 | 20.34 ms | 42.123 ms | 42.127 ms | 46.757 ms |
| 2026-01-15 | 19.64 ms | 40.995 ms | 41.337 ms | 45.904 ms |
| 2026-01-16 | 19.242 ms | 41.645 ms | 40.508 ms | 44.386 ms |
| 2026-01-17 | 19.996 ms | 41.185 ms | 41.19 ms | 43.073 ms |
| 2026-01-18 | 19.344 ms | 39.678 ms | 40.503 ms | 28.193 ms |
| 2026-01-19 | 18.812 ms | 41.726 ms | 41.633 ms | 26.42 ms |
| 2026-01-20 | 18.446 ms | 42.437 ms | 41.808 ms | 26.635 ms |
| 2026-01-21 | 19.065 ms | 43.56 ms | 42.256 ms | 27.34 ms |
| 2026-01-22 | 21.194 ms | 42.677 ms | 41.283 ms | 26.822 ms |
| 2026-01-23 | 20.159 ms | 40.591 ms | 40.862 ms | 27.194 ms |
| 2026-01-24 | 20.371 ms | 42.036 ms | 42.663 ms | 27.302 ms |
| 2026-01-25 | 20.672 ms | 42.524 ms | 42.909 ms | 26.244 ms |
| 2026-01-26 | 21.469 ms | 41.043 ms | 41.951 ms | 26.642 ms |
| 2026-01-27 | 21.2 ms | 40.704 ms | 43.805 ms | 26.056 ms |
| 2026-01-28 | 42.866 ms | 41.031 ms | 44.707 ms | 27.084 ms |
| 2026-01-29 | 23.28 ms | 40.803 ms | 42.875 ms | 27.542 ms |
| 2026-01-30 | 21.987 ms | 40.653 ms | 43.857 ms | 26.499 ms |
| 2026-01-31 | 23.088 ms | 42.23 ms | 45.612 ms | 26.255 ms |
| 2026-02-01 | 23.107 ms | 42.732 ms | 44.819 ms | 27.916 ms |
| 2026-02-02 | 22.94 ms | 44.862 ms | 43.366 ms | 47.19 ms |
| 2026-02-03 | 21.01 ms | 40.964 ms | 44.807 ms | 45.08 ms |
| 2026-02-04 | 21.227 ms | 42.488 ms | 43.714 ms | 45.839 ms |
| 2026-02-05 | 21.965 ms | 42.298 ms | 45.366 ms | 47.117 ms |
| 2026-02-06 | 19.101 ms | 43.228 ms | 45.882 ms | 44.324 ms |
| 2026-02-07 | 18.1 ms | 43.199 ms | 42.735 ms | 44.848 ms |
| 2026-02-08 | 19.041 ms | 42.697 ms | 44.382 ms | 46.28 ms |
| 2026-02-09 | 19.855 ms | 44.793 ms | 43.539 ms | 45.675 ms |
| 2026-02-10 | 19.445 ms | 46.978 ms | 46.323 ms | 46.341 ms |
| 2026-02-11 | 19.456 ms | 44.805 ms | 44.921 ms | 36.248 ms |
| 2026-02-12 | 19.249 ms | 39.668 ms | 44.972 ms | 26.652 ms |
| 2026-02-13 | 18.891 ms | 41.686 ms | 41.827 ms | 35.765 ms |
| 2026-02-14 | 19.031 ms | 42.217 ms | 43.153 ms | 45.866 ms |
| 2026-02-15 | 17.555 ms | 43.205 ms | 45.17 ms | 45.198 ms |
| 2026-02-16 | 18.418 ms | 43.123 ms | 45.44 ms | 45.128 ms |
| 2026-02-17 | 20.365 ms | 43.165 ms | 44.26 ms | 45.17 ms |
| 2026-02-18 | 18.976 ms | 40.623 ms | 44.286 ms | 47.384 ms |
| 2026-02-19 | 19.015 ms | 41.86 ms | 43.407 ms | 46.763 ms |
| 2026-02-20 | 17.948 ms | 38.721 ms | 42.024 ms | 47.828 ms |
| 2026-02-21 | 17.736 ms | 37.507 ms | 43.648 ms | 45.53 ms |
| 2026-02-22 | 20.183 ms | 38.825 ms | 44.546 ms | 44.045 ms |
| 2026-02-23 | 18.703 ms | 38.367 ms | 43.85 ms | 46.197 ms |
| 2026-02-24 | 21.134 ms | 39.825 ms | 44.99 ms | 42.669 ms |
| 2026-02-25 | 18.364 ms | 39.747 ms | 42.411 ms | 26.975 ms |
| 2026-02-26 | 18.499 ms | 51.214 ms | 43.907 ms | 26.449 ms |
| 2026-02-27 | 19.209 ms | 40.415 ms | 42.871 ms | 27.206 ms |
| 2026-02-28 | 19.627 ms | 39.297 ms | 43.153 ms | 46.2 ms |
| 2026-03-01 | 20.061 ms | 41.027 ms | 42.028 ms | 45.557 ms |
| 2026-03-02 | 21.501 ms | 41.415 ms | 39.649 ms | 47.546 ms |
| 2026-03-03 | 21.206 ms | 43.529 ms | 37.005 ms | 45.301 ms |
| 2026-03-04 | 20.882 ms | 39.876 ms | 34.814 ms | 47.364 ms |
| 2026-03-05 | 20.843 ms | 39.609 ms | 34.763 ms | 46.328 ms |
| 2026-03-06 | 23.673 ms | 40.467 ms | 39.05 ms | 48.169 ms |
| 2026-03-07 | 19.979 ms | 40.15 ms | 41.92 ms | 47.985 ms |
| 2026-03-08 | 22.503 ms | 39.962 ms | 41.217 ms | 47.811 ms |
| 2026-03-09 | 23.81 ms | 40.188 ms | 32.893 ms | 44.389 ms |
| 2026-03-10 | 25.507 ms | 38.446 ms | 21.369 ms | 50.576 ms |
| 2026-03-11 | 25.68 ms | 30.404 ms | 22.847 ms | 44.726 ms |
| 2026-03-12 | 26.054 ms | 24.759 ms | 22.683 ms | 87.077 ms |
| 2026-03-13 | 26.335 ms | 25.786 ms | 22.632 ms | 45.749 ms |
| 2026-03-14 | 25.373 ms | 25.16 ms | 21.899 ms | 45.374 ms |
| 2026-03-15 | 25.526 ms | 28.659 ms | 22.643 ms | 45.01 ms |
| 2026-03-16 | 26.361 ms | 25.08 ms | 22.952 ms | 44.891 ms |
| 2026-03-17 | 26.186 ms | 25.341 ms | 22.724 ms | 46.556 ms |
| 2026-03-18 | 26.126 ms | 26.093 ms | 23.013 ms | 47.359 ms |
| 2026-03-19 | 32.213 ms | 25.202 ms | 23.008 ms | 89.244 ms |
| 2026-03-20 | 25.567 ms | 24.714 ms | 22.523 ms | 43.749 ms |
| 2026-03-21 | 28.741 ms | 25.143 ms | 22.349 ms | 45.01 ms |
| 2026-03-22 | 26.724 ms | 25.32 ms | 22.346 ms | 47.214 ms |
| 2026-03-23 | 26.012 ms | 25.607 ms | 24.337 ms | 45.751 ms |
| 2026-03-24 | 25.724 ms | 25.465 ms | 23.12 ms | 46.076 ms |
| 2026-03-25 | 25.847 ms | 25.434 ms | 22.861 ms | 46.413 ms |
| 2026-03-26 | 26.766 ms | 25.218 ms | 23.636 ms | 45.086 ms |
| 2026-03-27 | 29.706 ms | 25.47 ms | 22.329 ms | 45.73 ms |
| 2026-03-28 | 31.983 ms | 28.688 ms | 36.402 ms | 51.695 ms |
| 2026-03-29 | 26.816 ms | 27.299 ms | 29.994 ms | 46.032 ms |
| 2026-03-30 | 32.385 ms | 29.397 ms | 48.291 ms | 50.11 ms |
| 2026-03-31 | 32.914 ms | 33.209 ms | 59.155 ms | 55.649 ms |